AUTHOREA
Log in Sign Up Browse Preprints
LOG IN SIGN UP

1197 meteorology Preprints

Related keywords
meteorology covid-19 wrf transpiration regional climatology and food sciences atmospheric chemistry analytical climatology markus gross hydrology weather analysis public health geography agricultural meteorology computer-aided engineering atmospheric sciences temperature education data science climatology (global change) veterinary geophysics numerical modelling evaporation human society + show more keywords
tropical health precipitation tropical meteorology oceanography weather modification wind energy climate agricultural ecology other information and computing sciences weather atmospheric electricity indigenous studies geology biological sciences environmental sciences health sciences information and computing sciences satellite meteorology machine learning air pollution hydrometeorology hydrobiology humidity
FOLLOW
  • Email alerts
  • RSS feed
Please note: These are preprints and have not been peer reviewed. Data may be preliminary.
Climate change impacts on Robusta coffee production over Vietnam
Thi Lan Anh Dinh
Filipe Aires

Thi Lan Anh Dinh

and 2 more

October 28, 2022
The Central Highlands of Vietnam is the biggest Robusta coffee (Coffea canephora Pierre ex A.Froehner) growing region in the world. This study aims to identify the most important climatic variables that determine the current distribution of coffee in the Central Highlands and build a “coffee suitability” model to assess changes in this distribution due to climate change scenarios. A suitability model based on neural networks was trained on coffee occurrence data derived from national statistics on coffee-growing areas. Bias-corrected regional climate models were used for two climate change scenarios (RCP8.5 and RCP2.6) to assess changes in suitability for three future time periods (i.e., 2038-2048, 2059-2069, 2060-2070) relative to the 2009-2019 baseline. Average expected losses in suitable areas were 62% and 27% for RCP8.5 and RCP2.6, respectively. The loss in suitability due to RCP8.5 is particularly pronounced after 2060. Increasing mean minimum temperature during harvest (October-November) and growing season (March-September) and decreasing precipitation during late growing season (July-September) mainly determined the loss in suitable areas. If the policy commitments made at the Paris agreement are met, the loss in coffee suitability could potentially be compensated by climate change adaptation measures such as making use of shade trees and adapted clones.
When record breaking heat waves should not surprise: skewness, heavy tails and implic...
Nels Bjarke
Joseph Barsugli

Nels Bjarke

and 4 more

October 26, 2022
Extreme heat waves beset western North America during 2021, including a 46.7°C (116°F) observation in Portland, Oregon, an astonishing 5°C above the previous record. Using Portland as an example we provide evidence for a latent risk of extreme heat waves in the Pacific Northwest (PNW) and along the west coast of the United States where a maritime climate and its intrinsic variations yield a positive skewness in summertime daily maximum temperatures. A generalized Pareto extreme value analysis yields a heavy tailed distribution with a return period of 300-1000 years, indicating that, while rare, the event was possible, contrary to prior claims that the event was “virtually impossible”. We demonstrate that the extreme temperatures can be explained by the coincident extreme values of geopotential heights, and that the relationship between heights and extreme temperatures has not materially changed over the observational record. The dynamical nature of the event along with recent developments in stochastic theory justifies the use of skewed and heavy-tailed distributions which may provide the basis for a more proactive approach to managing the risk of future events.
Learning by doing: seasonal and diurnal features of tropical precipitation in a globa...
Hans Segura
Cathy Hohenegger

Hans Segura

and 3 more

October 21, 2022
Using the global and coupled ICON-Sapphire model with a grid spacing of \SI{5}{\kilo\meter}, we describe seasonal and diurnal features of the tropical rainbelt and assess the limits of ICON-Sapphire in representing tropical precipitation. Aside from the meridional migration, the tropical rainbelt exhibits a seasonal enlargement and a zonal migration. Surprisingly, ICON-Sapphire reproduces these characteristics with better performance over land than over ocean and with a very high degree of agreement to observations. ICON-Sapphire especially struggles in capturing the seasonal features of the tropical rainbelt over the oceans of the Eastern Hemisphere, an issue associated with a cold SST bias at the equator. ICON-Sapphire also shows that a perfect representation of the diurnal cycle of precipitation over land is not a requirement to capture the seasonal features of the rainbelt over land, while over the ocean, 5km is sufficient to adequately represent the diurnal cycle of precipitation.
The sensitivity of the El Niño- Indian monsoon teleconnection to Maritime Continent c...
Umakanth Uppara
Benjamin G. M. Webber

Umakanth Uppara

and 3 more

October 19, 2022
The study investigates how sea surface temperature (SST) anomalies surrounding the Maritime Continent (MC) modulate the impact of developing El Niño events on Indian Summer Monsoon (ISM) rainfall. Using a climate model we find that the ISM rainfall response to tropical Pacific SST anomalies of eastern and central Pacific El Niño events is sensitive to the details of cold SST anomalies surrounding the MC. Furthermore, the remote rainfall responses to regions of SST anomalies do not combine linearly and depend strongly on gradients in the SST anomaly patterns. The cold SST anomalies around the MC have a significantly larger impact on the ISM response to eastern Pacific events than to central Pacific events. These results show the usefulness of idealised modelling experiments, which offer insights into the complex interactions of the ISM with modes of climate variability.
Biocultural calendars in southwestern South America
Ricardo Rozzi
Ricardo Álvarez

Ricardo Rozzi

and 5 more

March 25, 2022
To integrate temporal and spatial dimensions of seasonal cycles, we combine two conceptual frameworks: ecological calendars and the “3Hs” model of the biocultural ethic. The latter values the vital links between human and other-than-human co-inhabitants, their life habits (e.g., cultural practices of human communities or life cycles of other-than-human species) and the structure, patterns and processes of their shared habitats. This integration enhances an understanding of core links between cultural practices and the life cycles of biocultural keystone species. As a synthesis, we use the term biocultural calendars to emphasize the co-constitutive nature of calendars that result from continuous interactions between dynamic biophysical and cultural processes. We apply biocultural calendars to examine cultural practices and socio-environmental changes in southwestern South America, specifically in Chile, spanning from (1) Cape Horn at the southern of the Americas in sub-Antarctic habitats inhabited by the Yagan indigenous community, (2) artisanal fisher communities in Chiloe; archipelagoes, (3) coastal regions of central-southern Chile inhabited by Lafkenche and Williche indigenous communities, to (4) high Andean habitats in northern Chile co-inhabited by Aymara communities along with domesticated camelids and a rich biodiversity. To illustrate biocultural calendars, we designed analemma diagrams that show the position of the Sun in the sky as seen from a fixed time and location, and linked to continuous renewal of astronomical, biological and cultural, seasonal cycles that sustain life. These biocultural calendars enhance the integration of indigenous and scientific knowledge to confront complex challenges of climate change faced by local communities and global society.
Effects of differences in aboveground dead organic matter types on the stand-scale ne...
Hayato Abe

Hayato Abe

May 04, 2022
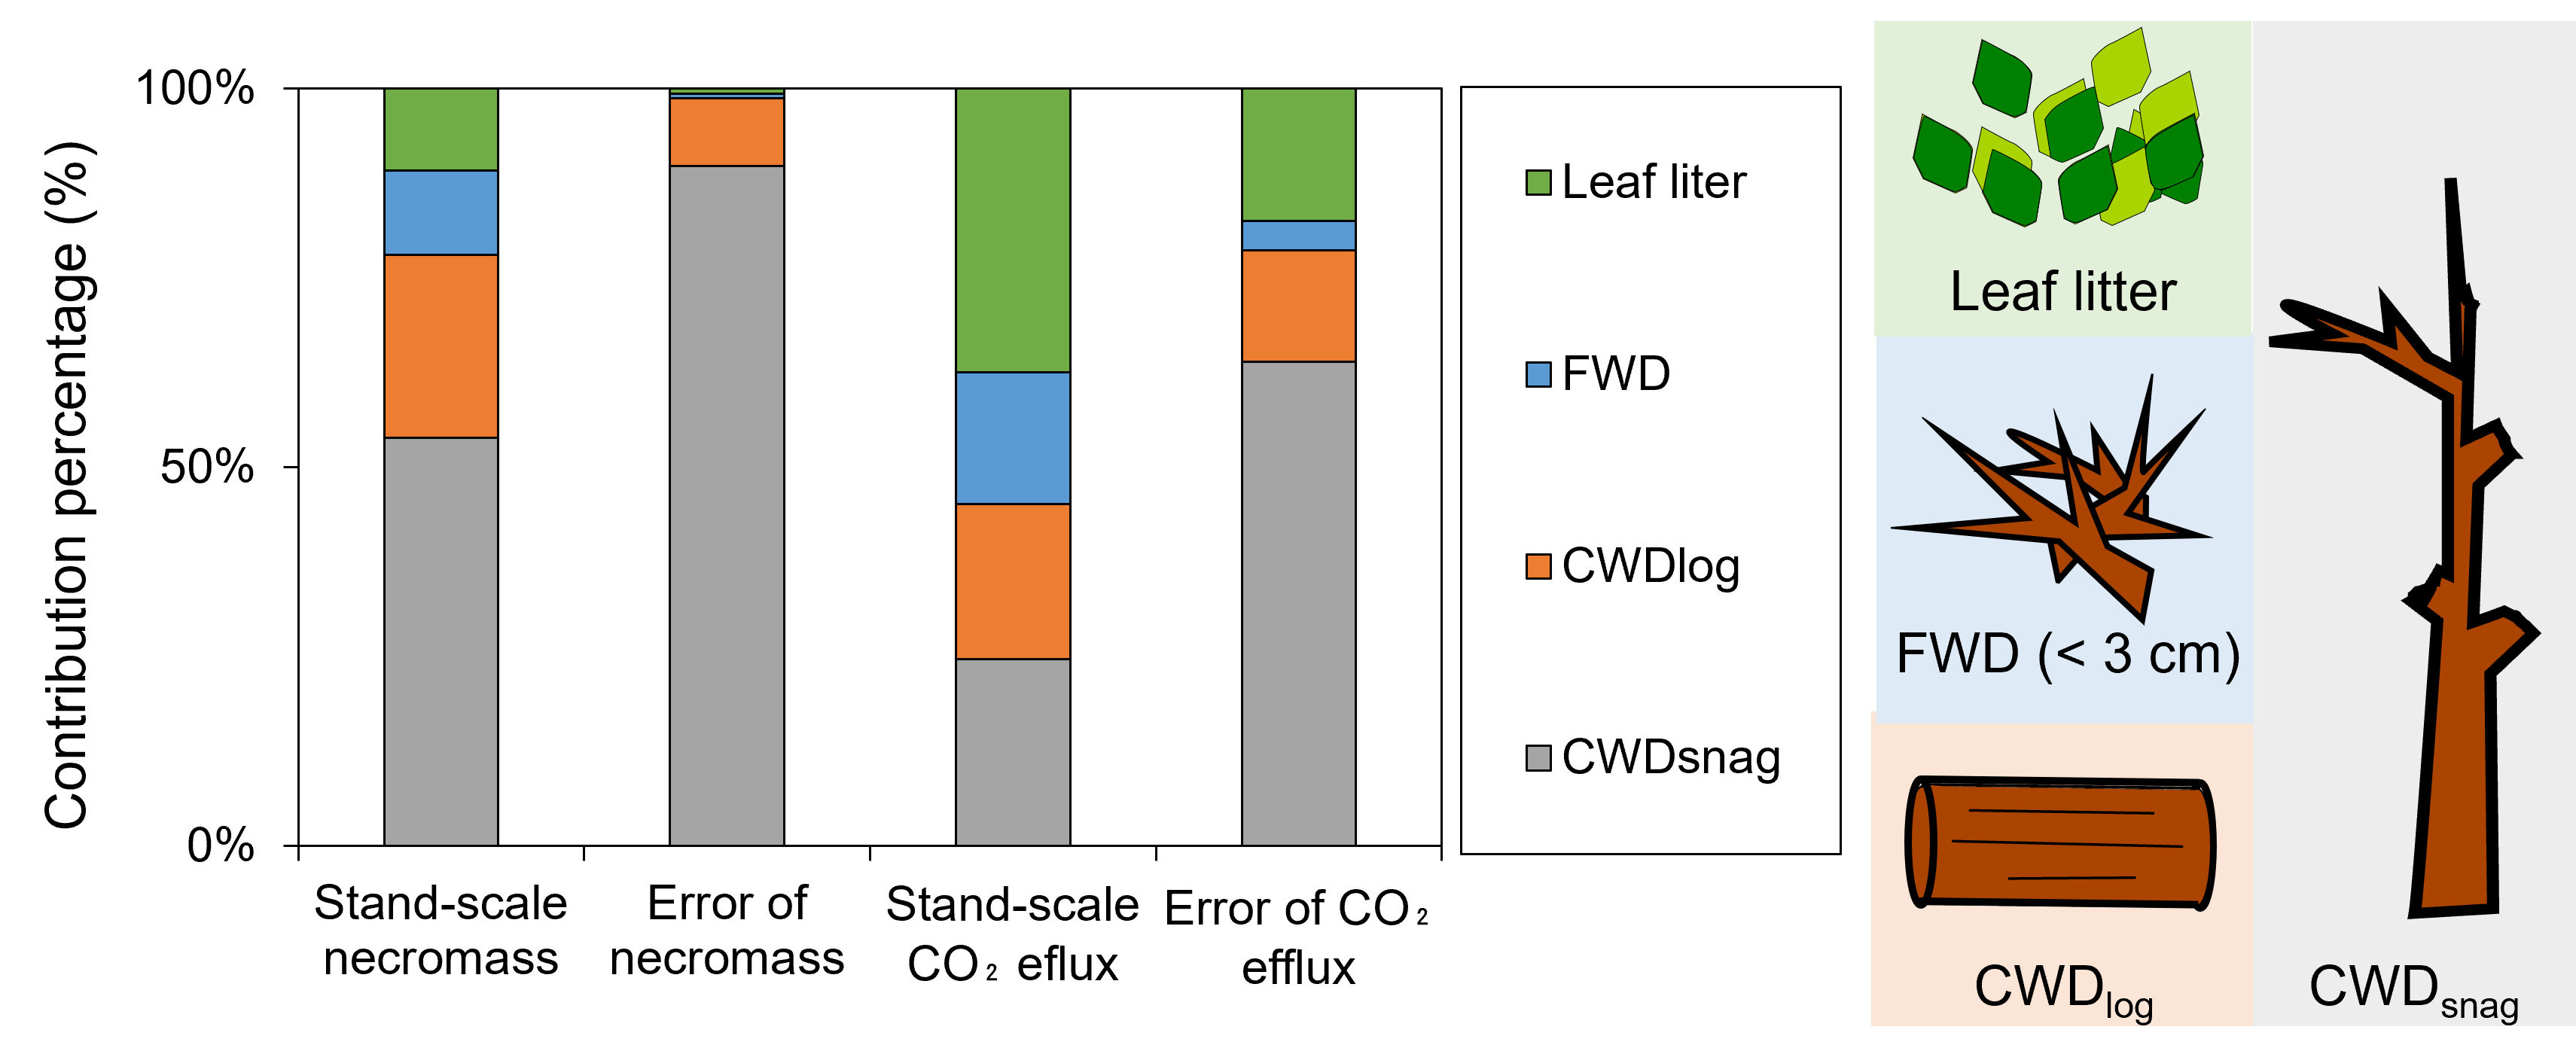
[This presentation is published at https://doi.org/10.1111/1440-1703.12317] Dead organic matter (DOM), which consists of leaf litter, fine woody debris (FWD; < 3 cm diameter), downed coarse woody debris (CWDlog), and standing or suspended coarse woody debris (CWDsnag), plays a crucial role in forest carbon cycling. However, the contributions of each DOM type on stand-scale carbon storage (necromass) and stand-scale CO2 efflux (Rstand) estimates are not well understood. In addition, there is little knowledge of the effect of each DOM type on the accuracy of stand-scale estimates of total necromass and Rstand. This study investigated characteristics of necromass and Rstand from DOM in a subtropical forest in Okinawa island, Japan, to quantify the effect of each DOM type on total necromass, total Rstand, and estimate error of total necromass and Rstand. The CWDsnag accounted for the highest proportion (54%) of total necromass (1499.7 g C m–2), followed by CWDlog (24%), FWD (11%), and leaf litter (11%). Leaf litter accounted for the highest proportion (37%) of total Rstand (340.6 g C m–2 yr–1), followed by CWDsnag (25%), CWDlog (20%), and FWD (17%). The CWDsnag was distributed locally with 173% of the coefficient of variation for necromass, which was approximately two times higher than those of leaf litter and FWD (72–73%). Our spatial analysis revealed, for accurate estimates of CWDsnag and CWDlog necromass, sampling areas of ≥ 28750 m2 and ≥ 2058‒42875 m2 were required, respectively, under the condition of 95% confidence level and 0.1 of accepted error. In summary, CWD considerably contributed to stand-scale carbon storage and efflux in this subtropical forest, resulting in a major source of errors in the stand-scale estimates. In forests where frequent tree death is likely to occur, necromass and Rstand of CWD are not negligible in considering the carbon cycling as in this study, and therefore need to be estimated accurately.
Tropical TGF Paradox: A Perspective From TRMM Precipitation Radar
Carlos A. Morales Rodriguez
Joan Montanya

Carlos A. Morales Rodriguez

and 4 more

May 05, 2020
The Terrestrial Gamma-ray Flashes (TGF) to lightning ratio, computed over the 3 tropical chimneys, presents a paradox: African thunderstorms produce the most lightning but yield the lowest fraction of TGF when compared to American and Southeast Asian thunderclouds. To understand the physical insights into this asymmetry, TRMM Precipitation Radar measurements are used to depict the vertical precipitation structure of the observed thunderstorms in the 3 regions and the thunderstorms during TGF occurrences detected by AGILE, Fermi-GBM and RHESSI sensors. African thunderstorms are taller, smaller and have higher concentration of dense ice particles above the freezing level. TGF thunderstorms are taller and less intense (0.5-2dBZ), besides presenting similar radar reflectivity decay with height independent of the region. In addition, these storms show thicker electrical charge layers separated by 4.7-5.2 km and also a positive charge fraction reduction between -20 o C and -40 o C and enhancement above -50 o C when compared to the overall thunderstorms.
Monitoring Vineyards with Planet Dove Satellites
David Helman

David Helman

January 24, 2019
Spectral-based vegetation indices (VI) have been shown to be good proxies of grapevine stem water potential (Ψstem), potentially assisting in irrigation-decision making of commercial vineyards. However, VI-Ψstem correlations are mostly reported at the leaf or canopy scales using sensors attached to leaves or very-high-spatial resolution images derived from sensors mounted on small airplanes or drones. Here, for the first time, we take advantage of the high spatial resolution (3-m), near-daily images acquired from Planet’s nano-satellites constellation to derive VI-Ψstem correlations at the vineyard scale. Weekly Ψstem were measured along the growing season of 2017 in six vines in 81 commercial vineyards and in 60 pairs of vines in a 2.4 ha experimental vineyard in Israel. The clip application programming interface (API), provided by Planet, and Google Earth Engine platform were used to derive spatially continuous time series of four VIs: GNDVI, NDVI, EVI, and SAVI in the 82 vineyards. Results show that per-week multivariable linear models using variables extracted from VI time series successfully tracked spatial variations in Ψstem across the experimental vineyard (Pearson’s-r = 0.45–0.84: N=60). A simple linear regression model enabled monitoring seasonal changes in Ψstem along the growing season in the vineyard (r = 0.80–0.82). Planet VIs and seasonal Ψstem data from the 82 vineyards were used to derive a ‘global’ model for in-season monitoring of Ψstem at the vineyard-level (r = 0.81: RMSE = 17.5%: N=970). The ‘global’ model, which requires only a few VI variables extracted from Planet images, may be used for real-time weekly assessment of Ψstem in Mediterranean vineyards, substantially reducing expenses of conventional monitoring efforts.
Markus Gross' Obituary
Vanesa Magar

Vanesa Magar

January 20, 2023
Markus Sebastian Gross passed away on 25 January 2022, due to the injuries he sustained during a household accident on 8 January 2022, and unexpected complications at the treating hospital. In this obituary we honor his character and his contributions to science and engineering.
Effects of Temperature and Humidity on COVID- 19 Transmission in Tropical Climate: Th...
Sakib Imtiaz

Sakib Imtiaz

January 02, 2023
A document by Sakib Imtiaz. Click on the document to view its contents.
The Intrinsic 150-day Periodicity of the Southern Hemisphere Extratropical Large-Scal...
Sandro W. Lubis
Pedram Hassanzadeh

Sandro W. Lubis

and 1 more

October 24, 2022
The variability of the Southern Hemisphere (SH) extratropical large-scale circulation is dominated by the Southern Annular Mode (SAM), whose timescale is extensively used as a key metric in evaluating state-of-the-art climate models. Past observational and theoretical studies suggest that the SAM lacks any internally generated (intrinsic) periodicity. Here, we show, using observations and a climate model hierarchy, that the SAM has an intrinsic 150-day periodicity. This periodicity is robustly detectable in the power spectra and principal oscillation patterns (aka dynamical mode decomposition) of the zonal-mean circulation, and in hemispheric-scale precipitation and ocean surface wind stress. The 150-day period is consistent with the predictions of a new reduced-order model for the SAM, which suggests that this periodicity is tied with a complex interaction of turbulent eddies and zonal wind anomalies, as the latter propagate from low to high latitudes. These findings present a rare example of periodic oscillations arising from the internal dynamics of the extratropical turbulent circulations. Based on these findings, we further propose a new metric for evaluating climate models, and show that some of the previously reported shortcomings and improvements in simulating SAM’s variability connect to the models’ ability in reproducing this periodicity. We argue that this periodicity should be considered in evaluating climate models and understanding the past, current, and projected Southern Hemisphere climate variability.
Clouds and radiatively induced circulations (Invited Chapter for the AGU Geophysical...
Tra Dinh
Blaž Gasparini

Tra Dinh

and 2 more

October 19, 2022
In the atmosphere, there is an intimate relationship between clouds, atmospheric radiative cooling/heating, and radiatively induced circulations at various temporal and spatial scales. This coupling remains not well under- stood, which contributes to limiting our ability to model and predict clouds and climate accurately. Cloud liquid and ice particles interact with both shortwave (SW) and longwave (LW) radiation, leading to cloud radiative effect (CRE). The CRE includes perturbations of the radiative fluxes at the top of the atmosphere (TOA) and the surface, as well as perturbations of the radiative cooling pro- file within the atmosphere. The effect of clouds that results in atmospheric radiative heating or cooling that is distinct from the clear-sky radiative cooling profile will be termed the CRE on atmospheric heating, or CRE-AH. The CRE-AH can significantly modify the horizontal and vertical gradients of the diabatic heating profile, inducing circulations at various scales in the atmosphere. In turn, circulations govern cloud formation and evolution processes and therefore the properties and distribution of clouds.
Machine Learning and Remote sensing method to Determine the Relationship Between Clim...
Adya Aiswarya Dash
Abhijit Mukherjee

Adya Aiswarya Dash

and 1 more

December 06, 2022
Through machine learning and remote sensing, a high-end model with a finer resolution for groundwater recharge has been developed for the region of South-East Asia. The groundwater recharge coefficient can be found by the application of Random Forest regression followed by the implication of the water budget method to calculate the Groundwater Recharge values. Climatic factors such as precipitation and actual evapotranspiration to map Groundwater Recharge has been framed with a sophisticated machine learning method to be considered as a scale predicting model. A comprehensive visualization of the dataset has been done; the accuracy of the model is noted through random forest regression. Thus, the model can be used for various regions of the dataset specifically for the area where there is a lack of reach for data. It can be successfully used to form a sophisticated end-to-end ML model. Keywords: Machine Learning, Remote Sensing, Groundwater Recharge, Climate science.
Exploring the Role of Essential Water Variables (EWVs) in Monitoring Indicators for t...
Sushel Unninayar
Richard Lawford

sushel unninayar

and 1 more

December 05, 2022
Earth Observations (EO) systems aim to monitor nearly all aspects of the global Earth environment. Observations of Essential Water Variables (EWVs) together with advanced data assimilation models, could provide the basis for systems that deliver integrated information for operational and policy level decision making that supports the Water-Energy-Food-Nexus (EO4WEF), and concurrently the UN Sustainable Development Goals (SDGs), and UN Framework Convention on Climate Change (UNFCCC). Implementing integrated EO for GEO-WEF (EO4WEF) systems requires resolving key questions regarding the selection and standardization of priority variables, the specification of technologically feasible observational requirements, and a template for integrated data sets. This paper presents a concise summary of EWVs adapted from the GEO Global Water Sustainability (GEOGLOWS) Initiative and consolidated EO observational requirements derived from the GEO Water Strategy Report (WSR). The UN-SDGs implicitly incorporate several other Frameworks and Conventions such as The Sendai Framework for Disaster Risk Reduction; The Ramsar Convention on Wetlands; and the Aichi Convention on Biological Diversity. Primary and Supplemental EWVs that support WEF Nexus & UN-SDGs, and Climate Change are specified. The EO-based decision-making sectors considered include water resources; water quality; water stress and water use efficiency; urban water management; disaster resilience; food security, sustainable agriculture; clean & renewable energy; climate change adaptation & mitigation; biodiversity & ecosystem sustainability; weather and climate extremes (e.g., floods, droughts, and heat waves); transboundary WEF policy.
Using A Phase Space of Environmental Variables to Drive an Ensemble of Cloud-resolvin...
Ehsan Erfani
Robert Wood

Ehsan Erfani

and 4 more

December 05, 2022
Low marine clouds are a major source of uncertainty in cloud feedbacks across climate models and in forcing by aerosol-cloud interactions. The evolution of these clouds and their response to aerosol are sensitive to the ambient environmental conditions, so it is important to be able to determine different responses over a representative set of conditions. Here, we propose a novel approach to encompassing the broad range of conditions present in low marine cloud regions, by building a library of observed environmental conditions. This approach can be used, for example, to more systematically test the fidelity of Large Eddy Simulations (LES) in representing these clouds. ERA5 reanalysis and various satellite observations are used to extract and derive macrophysical and microphysical cloud-controlling variables (CCVs) such as SST, estimated inversion strength (EIS), subsidence, and cloud droplet number concentrations. A few locations in the stratocumulus (Sc) deck region of the Northeast Pacific during summer are selected to fill out a phase space of CCVs. Thereafter, Principal Component Analysis (PCA) is applied to reduce the dimensionality and to select a reduced set of components that explain most of the variability among CCVs in order to efficiently select cases for LES simulations that encompass the observed CCV phase space. From this phase space, 75-100 cases with distinct environmental conditions will be selected and used to initialize 2-day LES modeling to provide a spectrum of aerosol-cloud interactions and Sc-to-Cumulus transition under observed ambient conditions. Such a large number of simulations will help create statistics to assess how well the LES can simulate the cloud lifecycle when constrained by the ‘best estimate’ of the environmental conditions, and how sensitive the modeled clouds are to changes in these driving fields.
Exploring the Role of Essential Water Variables (EWVs) in Monitoring Indicators for t...
Sushel Unninayar

sushel unninayar

December 03, 2022
Earth Observations (EO) systems aim to monitor nearly all aspects of the global Earth environment. Observations of Essential Water Variables (EWVs) together with advanced data assimilation models, could provide the basis for systems that deliver integrated information for operational and policy level decision making that supports the Water-Energy-Food-Nexus (EO4WEF), and concurrently the UN Sustainable Development Goals (SDGs), and UN Framework Convention on Climate Change (UNFCCC). Implementing integrated EO for GEO-WEF (EO4WEF) systems requires resolving key questions regarding the selection and standardization of priority variables, the specification of technologically feasible observational requirements, and a template for integrated data sets. This paper presents a concise summary of EWVs adapted from the GEO Global Water Sustainability (GEOGLOWS) Initiative and consolidated EO observational requirements derived from the GEO Water Strategy Report (WSR). The UN-SDGs implicitly incorporate several other Frameworks and Conventions such as The Sendai Framework for Disaster Risk Reduction; The Ramsar Convention on Wetlands; and the Aichi Convention on Biological Diversity. Primary and Supplemental EWVs that support WEF Nexus & UN-SDGs, and Climate Change are specified. The EO-based decision-making sectors considered include water resources; water quality; water stress and water use efficiency; urban water management; disaster resilience; food security, sustainable agriculture; clean & renewable energy; climate change adaptation & mitigation; biodiversity & ecosystem sustainability; weather and climate extremes (e.g., floods, droughts, and heat waves); transboundary WEF policy.
GC31B-06 Exploring the Role of Essential Water Variables (EWVs) in Monitoring Indicat...
Sushel Unninayar
Richard Lawford

Sushel Unninayar

and 1 more

December 03, 2022
Earth Observations (EO) systems aim to monitor nearly all aspects of the global Earth environment. Observations of Essential Water Variables (EWVs) together with advanced data assimilation models, could provide the basis for systems that deliver integrated information for operational and policy level decision making that supports the Water-Energy-Food-Nexus (EO4WEF), and concurrently the UN Sustainable Development Goals (SDGs), and UN Framework Convention on Climate Change (UNFCCC). Implementing integrated EO for GEO-WEF (EO4WEF) systems requires resolving key questions regarding the selection and standardization of priority variables, the specification of technologically feasible observational requirements, and a template for integrated data sets. This paper presents a concise summary of EWVs adapted from the GEO Global Water Sustainability (GEOGLOWS) Initiative and consolidated EO observational requirements derived from the GEO Water Strategy Report (WSR). The UN-SDGs implicitly incorporate several other Frameworks and Conventions such as The Sendai Framework for Disaster Risk Reduction; The Ramsar Convention on Wetlands; and the Aichi Convention on Biological Diversity. Primary and Supplemental EWVs that support WEF Nexus & UN-SDGs, and Climate Change are specified. The EO-based decision-making sectors considered include water resources; water quality; water stress and water use efficiency; urban water management; disaster resilience; food security, sustainable agriculture; clean & renewable energy; climate change adaptation & mitigation; biodiversity & ecosystem sustainability; weather and climate extremes (e.g., floods, droughts, and heat waves); transboundary WEF policy.
Assessing Contributions of Hydrometeorological Drivers to Socioeconomic Impacts of Co...
Javed Ali
Thomas Wahl

Javed Ali

and 4 more

December 02, 2022
Natural hazards such as floods, hurricanes, heatwaves, and wildfires cause significant economic losses (e.g., agricultural and property damage) as well as a high number of fatalities. Natural hazards are often driven by univariate or multivariate hydrometeorological drivers. Therefore, it is crucial to understand how and which hydrometeorological variables (i.e., drivers) combine to contribute to the impacts of these hazards. Additionally, when multiple drivers are associated with a hazard, traditional univariate risk assessment approaches are insufficient to cover the full spectrum of impact-relevant conditions originating from different combinations of multiple drivers. Based on historical socioeconomic loss data, we develop an impact-based approach to assess the influence of different hydrometeorological drivers on the impacts caused by different hazard event types. We use the Spatial Hazard Events and Losses Database for the United States (SHELDUS™) to identify the historical hazard events that caused socioeconomic impacts (property and crop damage, injuries, and fatalities) in our case study area, Miami-Dade County, in south Florida. For 9 different hazard types, we obtained data for 13 hydrometeorological drivers from historical in-situ observations and reanalysis products corresponding to the timing and locations of the hazard events found in the SHELDUS database. The relative importance of each hazard driver in generating impacts and the frequency of multiple drivers was then assessed. We found that many high-impact events were caused by multiple hydrometeorological drivers (i.e., compound events). For example, 61% of the recorded flooding events were compound events rather than univariate hazards and these contributed 99% of total property damage and 98.2% of total crop damage in Miami-Dade County. For several hazards, such as hurricanes/tropical storms and wildfires, all the events that caused damage are classified as compound events in our framework. Our findings emphasize the benefit of including socioeconomic impact information when analyzing hazard events, as well as the importance of analyzing all relevant hydrometeorological drivers to identify compound events.
Direct Sampling for Extreme Events Generation and Spatial Variability Enhancement of...
Jorge Luis Guevara Diaz
Maria Garcia

Jorge Luis Guevara Diaz

and 10 more

December 02, 2022
A document by Jorge Luis Guevara Diaz. Click on the document to view its contents.
Fate and changes in moisture evaporated from the Tibetan Plateau (2000-2020)
Chi Zhang
Deliang Chen

Chi Zhang

and 3 more

December 02, 2022
Total evaporation from the vast terrain of the Tibetan Plateau (TP) may strongly influence downwind regions. However, the ultimate fate of this moisture remains unclear. This study tracked and quantified TP-originating moisture. The results show that the TP moisture participation in downwind regions’ precipitation is the strongest around the eastern edge of the TP and then weakens gradually toward the east. Consequently, TP moisture in the composition of precipitation over the central-eastern TP is the largest of over 30%. 44.9-46.7% of TP annual evaporation is recycled over the TP, and about 2/3 of the TP evaporation is reprecipitated over terrestrial China. Moisture cycling of TP origin shows strong seasonal variation, with seasonal patterns largely determined by precipitation, evaporation and wind fields. High levels of evaporation and precipitation over the TP in summer maximize local recycling intensity and recycling ratios. Annual precipitation of TP origin increased mainly around the northeastern TP during 2000-2020. This region consumed more than half of the increased TP evaporation. Further analyses showed that changes in reprecipitation of TP origin were consistent with precipitation trends in nearby downwind areas: when intensified TP evaporation meets intensified precipitation, more TP moisture is precipitated out. The model estimated an annual precipitation recycling ratio (PRR) of 26.9-30.8% in forward moisture tracking. However, due to the non-closure issue of the atmospheric moisture balance equation, the annual PRR in backward tracking can be ~6% lower.
Entropy Field Decomposition Analysis of Atmospheric River Formation
Lawrence Frank
Vitaly L Galinsky

Lawrence Robert Frank

and 3 more

December 01, 2022
A novel method for estimating spatial-temporal modes of time varying data containing complex non-linear interacting multivariate fields, called the entropy field decomposition (EFD), is applied to the problem of characterizing the formation and intensification of atmosphere rivers (ARs), and reveals two novel findings. First, analysis of global time-varying interacting wind (w) and specific humidity (q) fields produces spatiotemporal modes consistent with observed global distribution of ARs detected by Integrated Water Vapor Transport (IVT). Secondly, space-time information trajectories (STITs) generated from coupled w-q EFD modes, representing optimal (in the sense of maximum entropy) parameter pathways, reveal a clear connection between ARs and planetary-scale circulation with structure similar to Rossby waves and reveal that ARs appear to be dynamically linked with the outflow region of the wave troughs. These findings provide an automated quantitative method to examine impacts of interacting multiscale dynamics on AR formation and activities.
Wet and Dry Cold Surges over the Maritime Continent
Isaac Tan
Michael J. Reeder

Isaac Tan

and 4 more

November 29, 2022
Cold surges are synoptic weather systems that occur over the Maritime Continent during the boreal winter. They are characterised by the strengthening of prevailing low-level northerly to north-easterly winds, temperature falls of a few degrees over several days, and in some cases, extreme prolonged rainfall and flooding. We investigate the synoptic structure and development of cold surges through composites of dry, moderate and wet surges. Each surge category is defined by the distribution of precipitation averaged within a specified domain over the equatorial South China Sea. Over the Maritime Continent, most of the dry (wet) surges occur during the suppressed (active) phases of the Madden-Julian Oscillation (MJO). Dry surges are characterised by cross-equatorial flow and positive mean sea-level pressure anomalies which reach the Southern Hemisphere, and enhanced descent or weaker ascent. Wet surges coincide with a cyclonic circulation over Borneo, a lack of cross-equatorial flow, and enhanced moisture and ascent. We find that diurnal precipitation patterns are consistent with convective onset being controlled by the mid-tropospheric buoyancy of an idealised entraining plume. This buoyancy diagnostic suggests that wet surges are characterised by a moister free troposphere because this reduces the effect of entrainment and allows convection to penetrate the lower troposphere. Finally, deep (shallow) and relatively strong (weak) westerlies are found over southern Java and northern Australia during the dry (wet) surges. Consequently, Australian summer monsoon bursts are more likely to occur following dry cold surges. The westerlies are also explained as part of the larger-scale MJO circulations.
Impacts of Emission Changes and Meteorology on the Long-term (2013-2020) Ozone Trend...
Yurun Wang

Yurun Wang

November 29, 2022
Elevated ozone (O3) pollution in the warm season is an emerging environmental concern affecting global highly urbanized megacities. In southwestern China, full characterization of causes for O3 pollution has been stymied by limited observations and the dominant factors that influence O3 variability on a long-term basis still lack understanding. Herein, we identified O3 variations and inferred trends in precursor emissions in Chengdu over 2013–2020 based on extensive ambient measurements, emission inventory, and satellite data. Numerical models were used to investigate the changes in meteorological variability and biogenic emissions. Trends of O3 in urban areas show deterioration (+14.0% yr−1) between 2013 and 2016 followed by a slight decrease over 2017–2020, while O3 levels in rural areas generally show a downward trend (−2.9% yr−1) during 2014–2020. Both emission inventory (−3.7% yr−1) and OMI satellite columns (−4.5% yr−1) depict strong decline trends in NOx emissions, while satellite HCHO columns exhibit a flattened downward trend of VOC emissions (−1.8% yr−1), which caused rural areas shifted from VOCs-limited to transitional or NOx-limited regime since 2016. Considering metropolitan Chengdu remains VOCs-limited regime over time, the existing regulatory framework involving simultaneous NOx and VOCs control would result in evident O3 improvements in the near future. Despite benefits from anthropogenic emission reductions, we demonstrate that meteorological conditions and enhanced biogenic emissions over the warm season could partially or even fully offset effects attributed to emission changes, making the net effects obscure. This finding provides robust evidence of reductions in NOx and VOCs emission and informs effective O3 mitigation policies for megacities which undergo similar emission pathways in Chengdu.
The Urban Lightning Effect Revealed with Geostationary Lightning Mapper Observations
J.D. Burke
J. Marshall Shepherd

J.D. Burke

and 1 more

November 25, 2022
Within the Charlotte, North Carolina, to Atlanta, Georgia, megaregion (Charlanta), the Atlanta metropolitan area has been shown to augment proximal cloud-to-ground (CG) lightning occurrence. Although numerous studies have documented this “urban lightning effect” (ULE) with regard to CG lightning, relatively few have investigated urban effects on distributions of total lightning (TL). Moreover, there has yet to be a study of the ULE using TL observations from the Geostationary Lightning Mapper (GLM). In an effort to fill this gap, we investigated spatial distributions of TL around the cities of Atlanta, GA, Greenville, SC, and Charlotte, NC, using GLM data collected during the warm seasons of 2018–2021. Analyses reveal augmentation of total lightning intensity and frequency over the major cities of Atlanta and Charlotte, with a diminished urban signal over the smaller city of Greenville. This work also demonstrated the potential efficacy of the emerging satellite-based TL climatology in ULE studies.
← Previous 1 2 3 4 5 6 7 8 9 10 11 … 49 50 Next →
Back to search
Authorea
  • Home
  • About
  • Product
  • Preprints
  • Pricing
  • Blog
  • Twitter
  • Help
  • Terms of Use
  • Privacy Policy